Sports.
Every season is on tape. Graphon answers from your footage, game data, scouting reports and more.
Where should we build the new sign in the stadium, and will it pay for itself?
One answer, pulled from 23 home broadcasts, the play-by-play files, the sponsors’ audience report and the signage plan.
answered from 5 of 3,400 broadcasts, play files and reports
Of the two planned spots, the north-east band end is on TV longest, 1:43 a game across 23 home broadcasts. The main cameras sit on the west side and look east, so east-side spots fill the back of the standard shot.
The play-by-play shows 43% of that time comes in kicks, when the camera looks down the field at that end zone. Measured the same way as the sponsor panels beside it, that is worth about $345,000 a season in the audience report’s terms.
Against a $150,000 build, the sign pays back in its first season. Of the empty walls, the south-east tunnel is seen most.
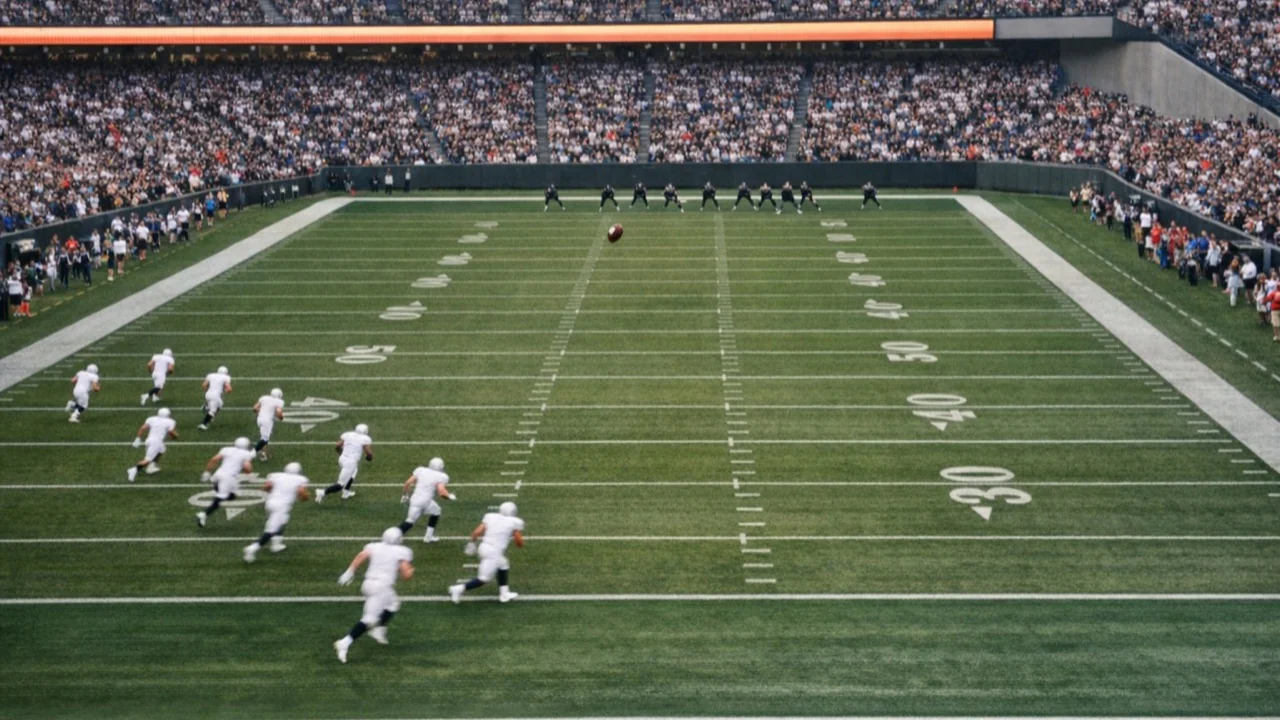 HIGH END ZONE · Q1 14:55
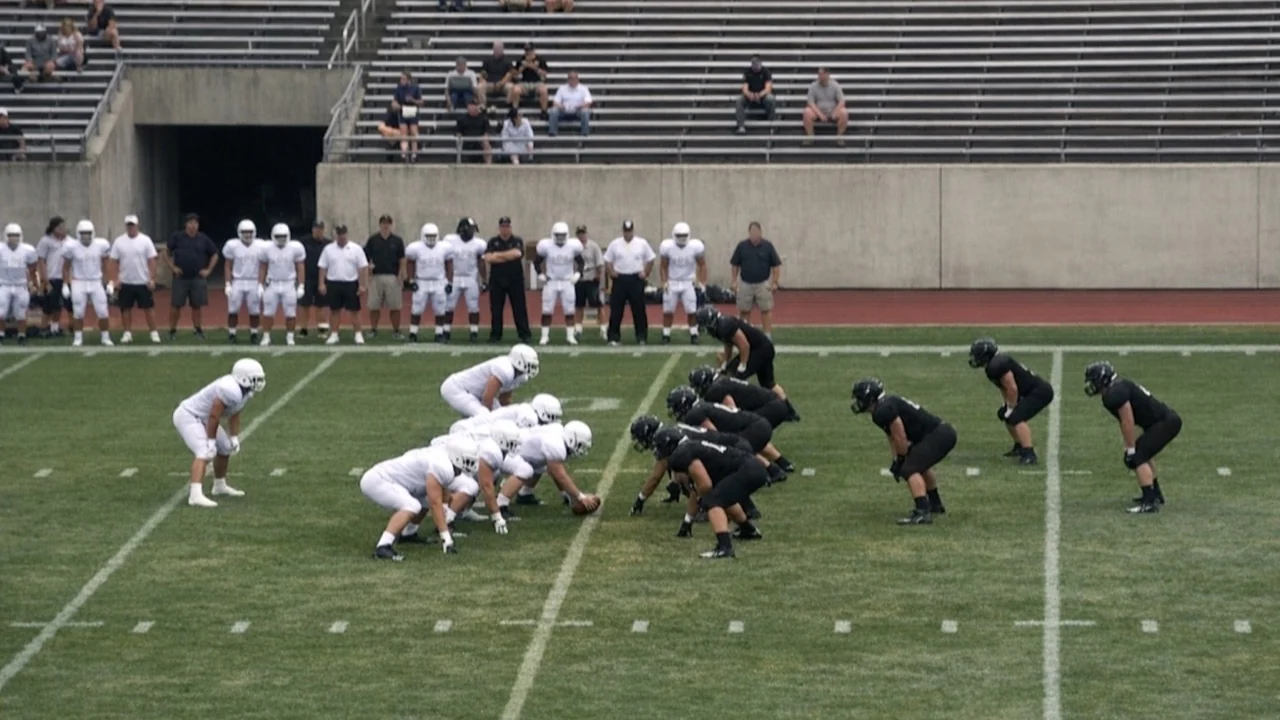 MAIN · WEST SIDELINE
Play-by-play · home game 14 · 143 plays
Q1 · kicks
15:00 · kickoff · 65 yds · touchback
14:55 · kickoff return · north end zone · 31 yds
08:12 · punt · 44 yds · fair catch
Sponsor audience report · lower-bowl panels
Exposure valuation · home games
Each second on screen is weighted for size, clarity and position in the shot.
Panels beside the north-east band end: valued per second of clear exposure, per game and per season.
| A | B | C | |
|---|---|---|---|
| 1 | |||
| 2 | North-east band end · planned | ||
| 3 | Regular season | Base case | |
| 4 | |||
| 5 | On TV a game | 1:43 | |
| 6 | Home games a season | 9 | |
| 7 | Season value | $345,000 | |
| 8 | Build cost | $150,000 | |
| 9 | Payback | season 1 |
The north-east end leads.
1 · 3 · 23 home broadcastsWhat the standard shot shows
MAIN · WEST SIDELINEHome broadcast · 1st half · 22:52 · main camera, west side
The main camera looks east across the field, so the far stands, the tunnel and the wall beside it fill the back of most plays.
How the sponsors are valued 4
Audience report · exposure valuation
Graphon measured the panels the way the report did, then priced the band end in the report’s own units.
The spot, and the case for it
5 · signage plan.xlsx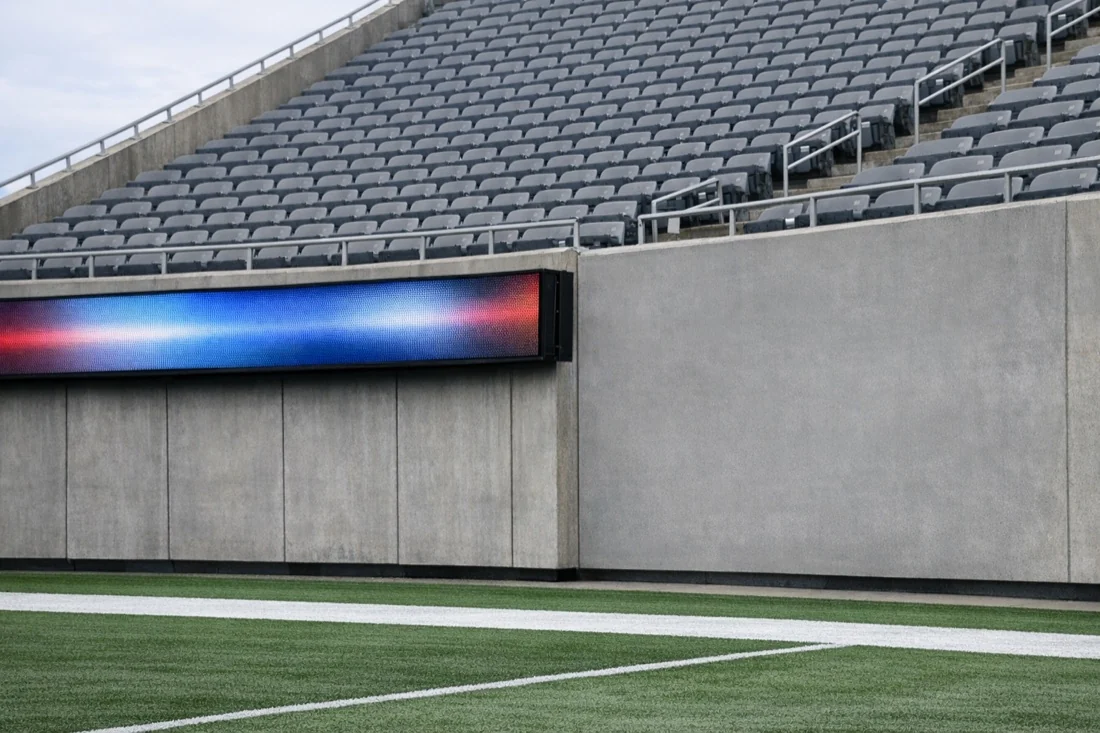
Nine home games a season; sign size as planned. A larger sign scales the value; the seconds and the ranking do not change.